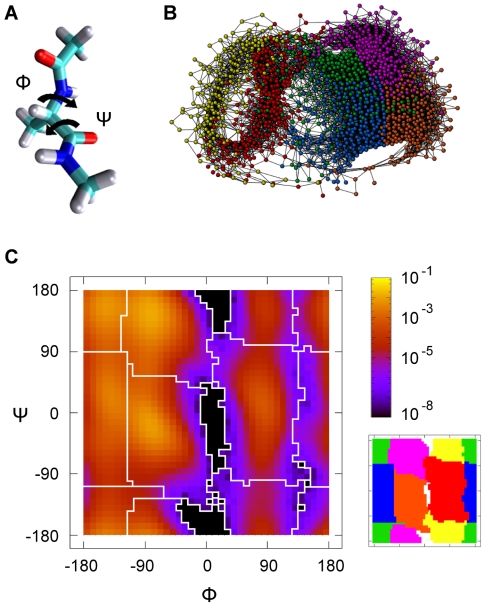
Figure 3. Free energy basins of the Alanine dipeptide.
(A) The dialanine dipeptide with the angles  and
and  . (B) Plot of the CMN generated. The 6 sets of nodes (corresponding to different colors) are the result of the SSD algorithm. (C) Left: Ramachandran plot with the probability of occupation of the cells used to build the CMN. The boundaries of the free energy basins are shown in white. Right: the 6 basins represented as regions of different color. (Color code:
  ,
,  ,
,  ,
,  ,
,  and
and  ).
).

