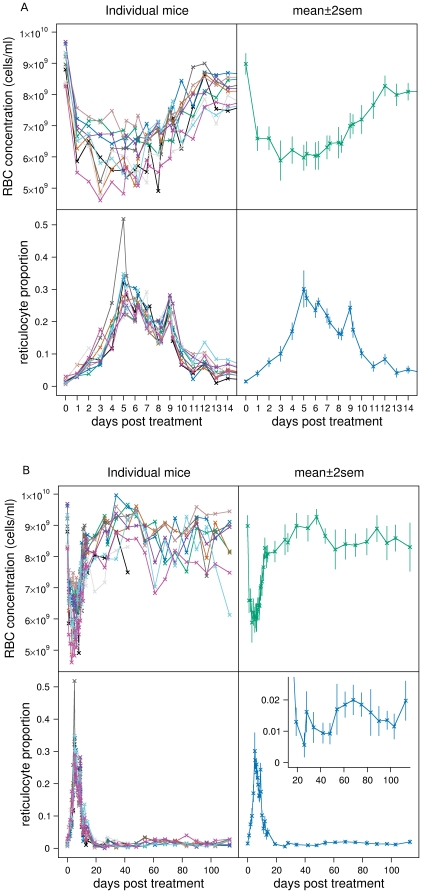
Figure 1. RBC and reticulocyte dynamics.
Individual mouse data (left panels) and mean±2sem (right panels) of RBC concentration (top panels) and reticulocyte proportion (bottom panels) of the 10 mice in the main experiment for A: first 14 days, B: full 114 days. Inset expands reticulocyte proportion from days 15 to 114.

