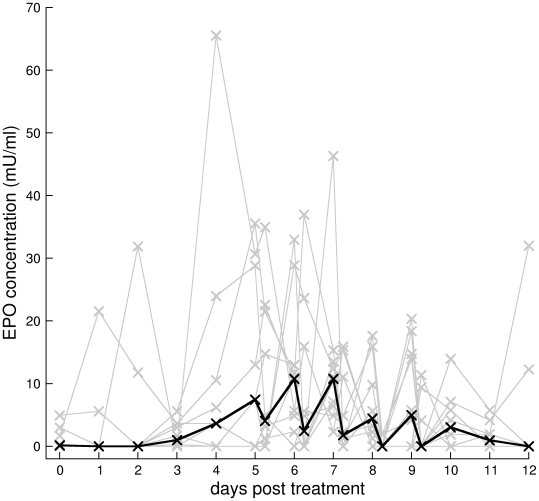
Figure 2. Serum Epo concentrations.
Serum Epo concentrations for individual mice (grey lines) and median (black line) of main experiment. The two samples per day on days 5 to 9 suggest diurnal oscillations. Because we had to sample small volumes of blood (20 µl) our Elisa assay detection threshold is above normal Epo concentration, hence the many zeros in the data.

