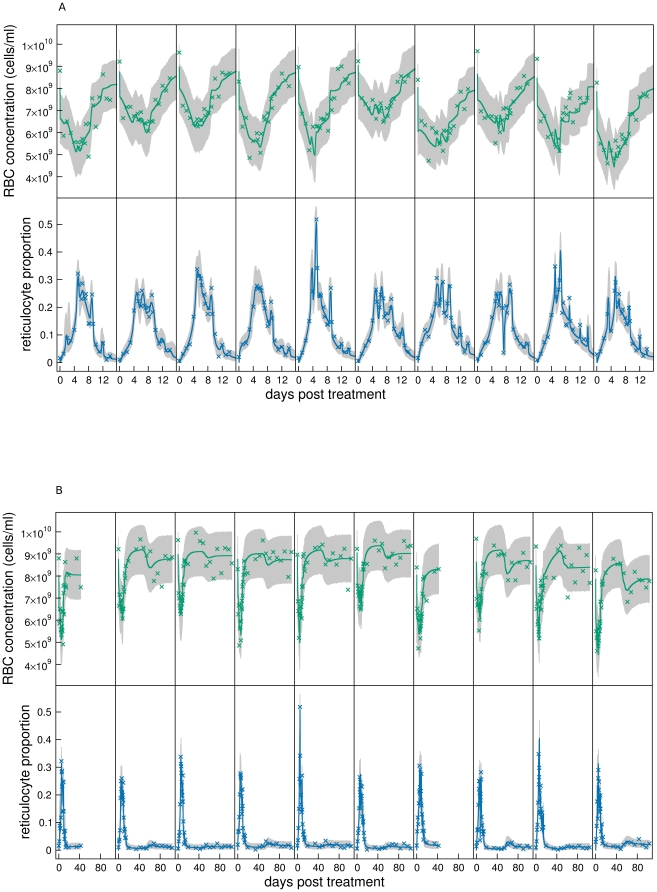
Figure 4. Model fits.
Fits of best fitting model to RBC concentrations and reticulocyte proportions of individual mice of the main experiment. A: First 14 days, and B: all data. Grey regions are 95% posterior predictive intervals (95% of data should lie within this region), and solid lines are median solutions constructed from the 104 samples of the posterior distribution.

