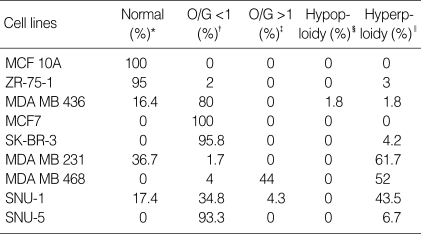
Table 3.
Results of bicolor FISH analysis
*Cell exhibited 2 pairs of orange and green colors; †The ratio of orange (representing the RUNX3 gene) to green (control) in the observed cell was less than 1; ‡The ratio of orange to green was more than 1; §Cell exhibited 2 pairs of orange and green colors; ∥Cell exhibited more than 2 pairs of orange and green colors.
FISH, fluorescent in situ hybridization.

