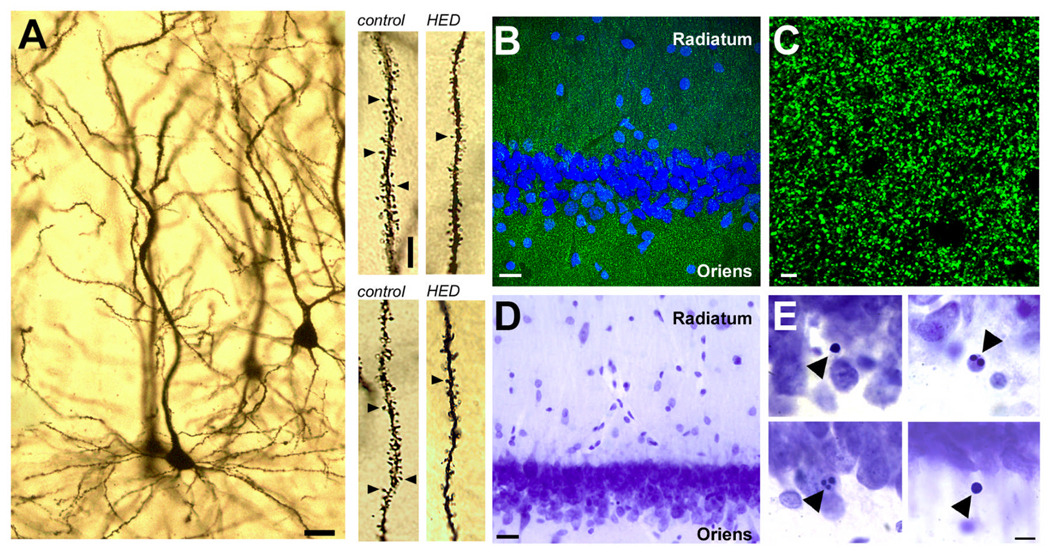
Figure 2. Excessive calorie intake reduces dendritic spine density and synaptic marker immunofluorescence, and increases the number of pyknotic nuclei in the CA1 region of the hippocampus.
A, Representative example of a CA1 neuron visualized with Golgi impregnation. Scale bar = 20 µm. Top right panel shows dendritic segments from the basal arbor of an animal on the control diet or the high-calorie diet (HCD), where indicated. Scale bar applies to all dendritic segments; length = 5 µm. Bottom right panel shows segments from apical oblique dendrites in animals fed the control diet or HCD, as indicated. B, Anatomical regions for analysis of synaptophysin labeling. Scale bar = 20 µm. C, Confocal micrograph showing synaptophysin labeling at the resolution and scale used for analysis. Scale bar = 2 µm. D, Low-magnification view of Nissl staining in hippocampal area CA1. Scale bar=20 µm. E, Examples of cells with condensed and/or fragmented nuclei. Scale bar=10 µm.

