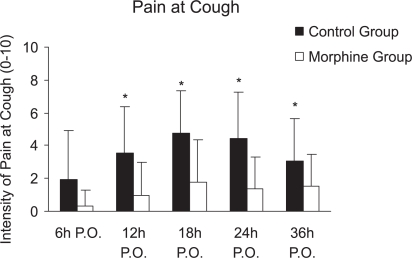
Figure 2 -.
Intensity of Pain between groups (means ± SEM). A. Pain at rest (p-value at 12, 18, 24, and 36h was 0.0095; 0.0013; 0.0089; 0.0446, respectively). B. Pain upon profound inspiration (p-values were 0.0291; 0.0005; 0.0004, respectively). C. Pain upon cough (p-values at 12, 18, 24, and 36 hours were 0.0019; 0.0010; 0.0218; 0.0145. - Mann-Whitney Test, p<0.05)

