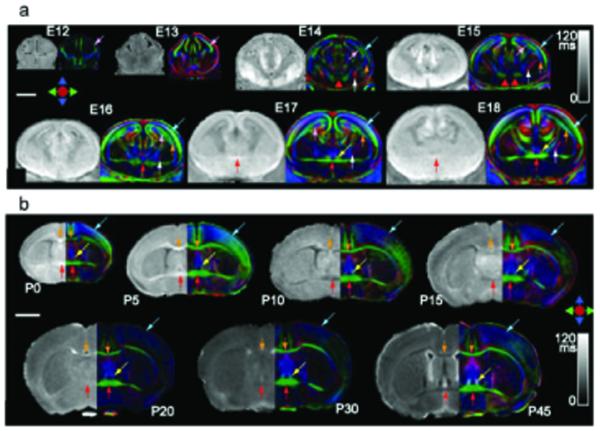
Figure 7.
DTI of developing mouse brains. (a) T2 and DTI color map images of embryonic mouse brains, from embryonic day (E) 12 to 18. (b) T2 and DTI maps of postnatal mouse brains, from postnatal day (P) 0 to 45. 3D images were carefully aligned to ensure proper orientation and position, and two-dimensional coronal images were selected at the level of the anterior commissure. T2 map images were scaled from 0 to 120 ms. Colored arrows indicate the location of the cortical plate (blue), the intermediate zone (orange) and the ventricular zone or neuroepithelium (pink) in embryonic brain (a). White matter tracts shown here include the anterior commissure (red arrows), the corpus callosum (orange arrows), the fornix (yellow arrows), and the internal capsule (white arrows) in postnatal brains (b). Scale bars are 2 mm. Reprinted, with permission, from ref. (28).

