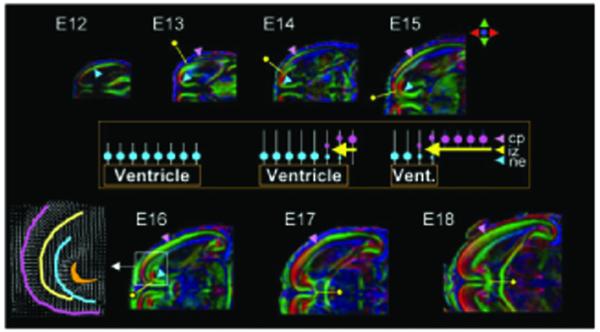
Figure 8.
Cortical and white matter development. Horizontal planes of the color maps from embryonic day (E)12 to 18 brains. Blue and pink arrowheads indicate locations of the neuroepithelium (ne) and cortical plate (cp). Yellow pins indicate the leading edge of the growing intermediate zone (iz) or axonal tracts in between the ne and cp. The inset diagram explains the cellular events during E12-E18 based on radial migration theory. Blue circles indicate neurons in the ne from newborn mice, white bars represent migration scaffolds by the radial glia, pink circles are neurons in the cp, and yellow arrows are the growing axons. At E12, there is only one layer (ne), which has radial structures around the ventricle. At E13, the cp emerges and simultaneously afferent and efferent axons (iz) arrive between the ne and cp layers, resulting in a transient three-layer structure. Between E14 and E18, the cp progresses to completion, with concomitant loss of the ne layer and ventricle shrinkage, while the axons follow the leading edge of the cp. A portion of the E16 brain (white box) is enlarged to show the fiber orientation in a vectorial format. Images in each panel are scaled independently. See ref. (26) for details on the spatial resolution of each image. Reprinted, with permission, from ref. (26).

