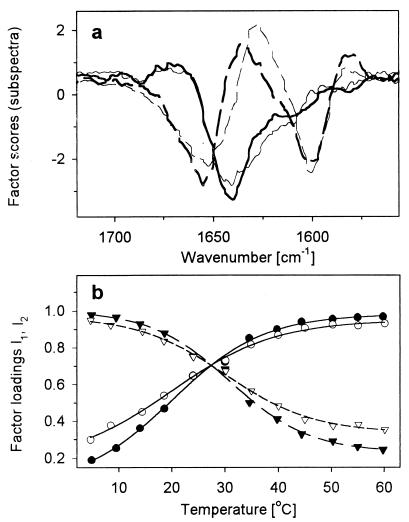
Figure 5.
Results of factor analysis of temperature dependence of amide I′ VCD spectra. (a) First (solid lines) and second (dashed lines) factor for L1 (thick lines) and L2 (thin lines) peptide. (b) First (●, ○) and second (▾, ▿) factor loadings for L1 (solid symbols) and L2 (empty symbols). Lines represent the least-squares sigmoidal fit (first loading, solid lines; second loading, dashed lines).

