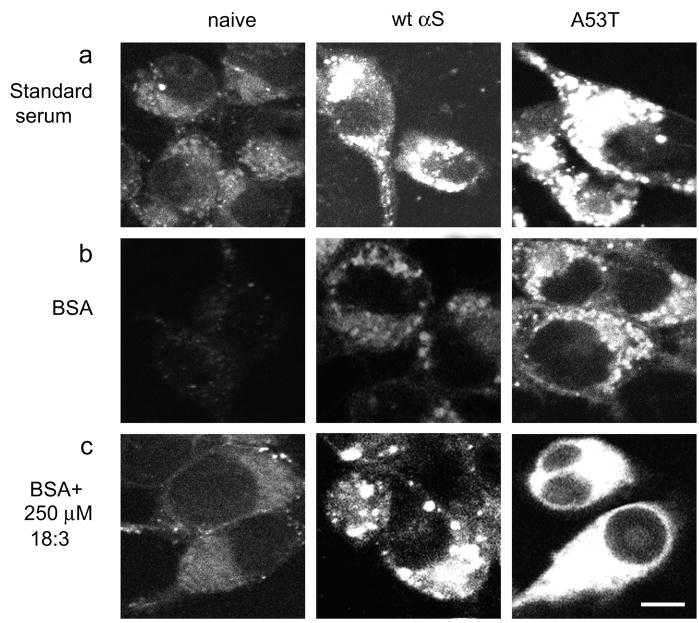
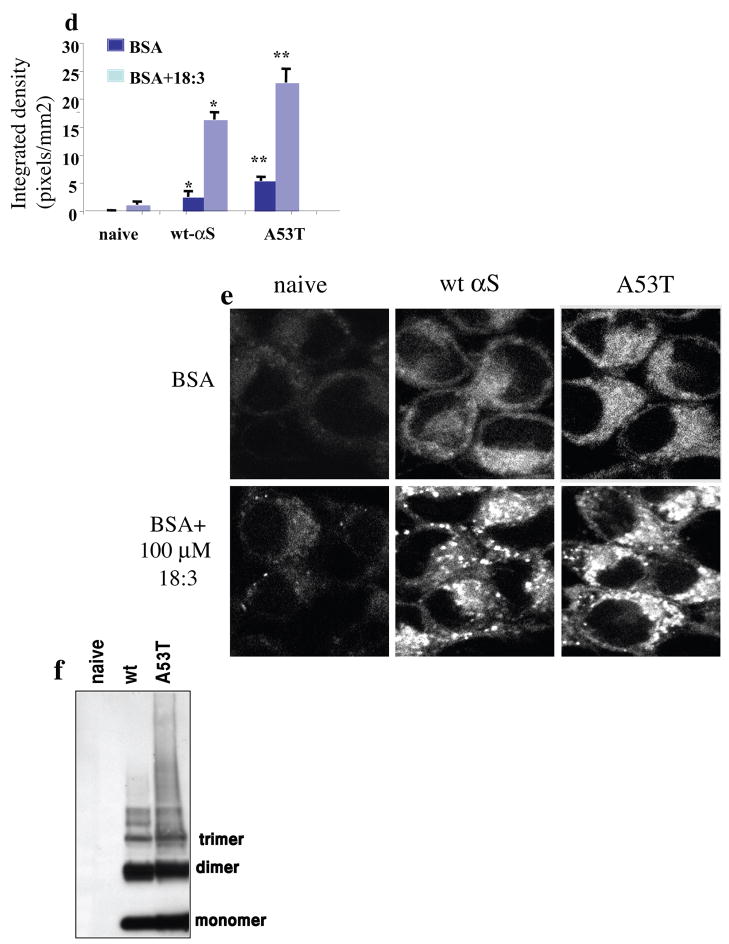
Figure 2. FM1-43 internalization into MES 23.5 dopaminergic cells is induced by αS over expression and 18:3 PUFA.
(a). Naive, wt and A53T αS over expressing MES cells conditioned in standard serum-containing medium and labeled with 2.5 μM FM1-43 fluorescent dye (molecular probes Eugene, OR) for 4 minutes. Access of dye was removed, and 10 minutes later the cells were fixed and tested for intracellular FM1-43 fluorescence. Pictures were taken in confocal, laser scanning microscope (Zeiss LSM 410) under non-saturating conditions. (b). Naïve, wt and A53T αS over expressing MES cells were conditioned for 16–18 hours in serum-free medium supplemented with 50μM BSA, followed by labeling with FM1-43 as in (a). (c). Cells as in (b) but conditioned in serum free medium supplemented with BSA only (50 μM) plus 250 μM 18:3 PUFA. (d). Quantitative presentation of the intracellular FM1-43 in BSA vs. PUFA treated cultures. Quantitation was performed on the captured images at selected image plane with the greatest intracellular FM1-43 signal, using ImageJ software, measuring the average fluorescence intensity (above threshold) across the entire cell divided by the area of the tested cell. Mean of 10–15 cells ± SD. * significant over the corresponding treatment in naïve cells and ** significant over the corresponding treatment in wt αS over expressing cells. TTEST P value < 0.05 (e) Cells were treated as in (b) and (c) but with 20 μM BSA with or without 100 μM 18:3 respectively. (f) Western blot of cytosolic extract from naïve, wt and A53T over expressing cells, treated for oligomers detection (49) and probed with anti αS H3C ab. Bar represents 10 μm.


