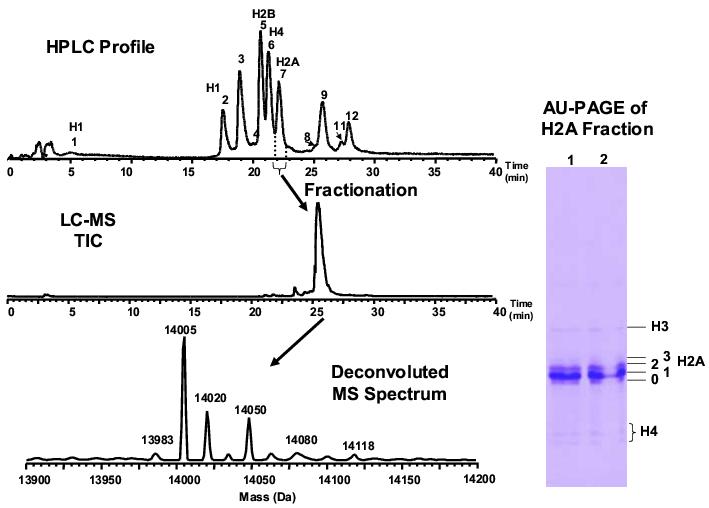
Figure 7.
Left) LC-MS profile of isolated H2A in fraction 7 (see Figure 2). The purity of H2A in the fraction is up to 95% due to the small amount of adjacent H3 and H4 species. RPLC conditions: Discovery C18 column 5 μm, 300 Å 1.0 mm × 150 mm; flow rate 50 μL/min. The conditions were optimized using easily available standards of bovine histones. Right) AU-PAGE of H2A fractionated by RPLC. The 0−3 labels represent different bands of H2A. The protein amount in band 3 was too little to be detected by MS. The concomitant H3 and H4 were well resolved from H2A. The histone H2A variants presented in this figure were derived from CLL cells.

