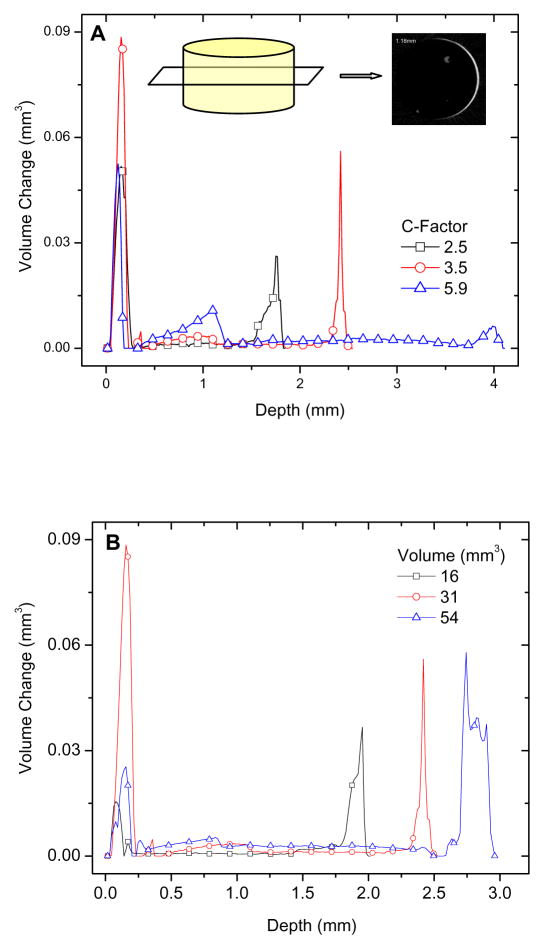
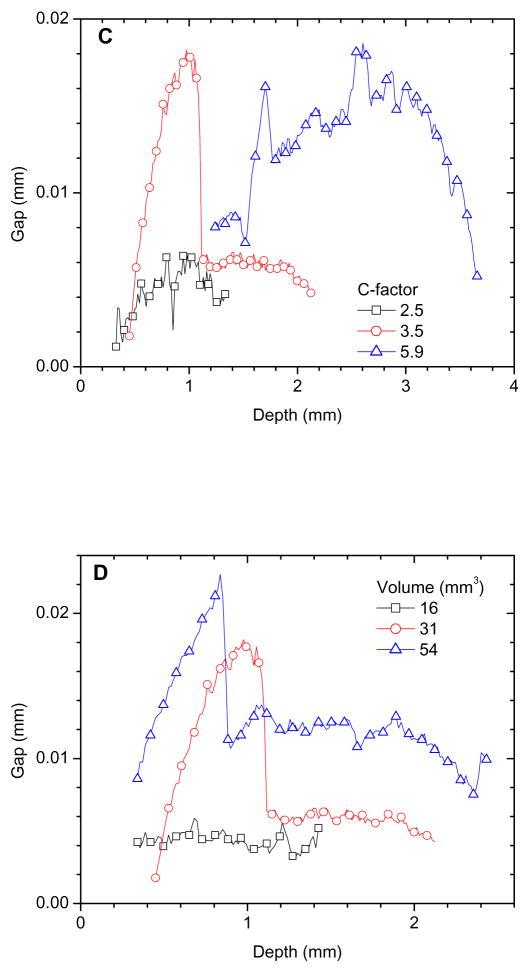
Figure 3.
Volume changes measured as a function of sample depth (at 16 μm intervals): (A) a series of samples with constant volume and varied C-factors, inset shows the area difference between polymerized and unpolymerized composite for one slice, from which the volume difference was calculated and plotted as one data point along the sample depth, and (B) a series of samples with constant C-factor and varied sample volumes; Gaps in the central portion as a function of depth:(C) a series of samples with constant volume but varied C-factors, and (D) a series of samples with constant C-factor but varied and sample volumes.


