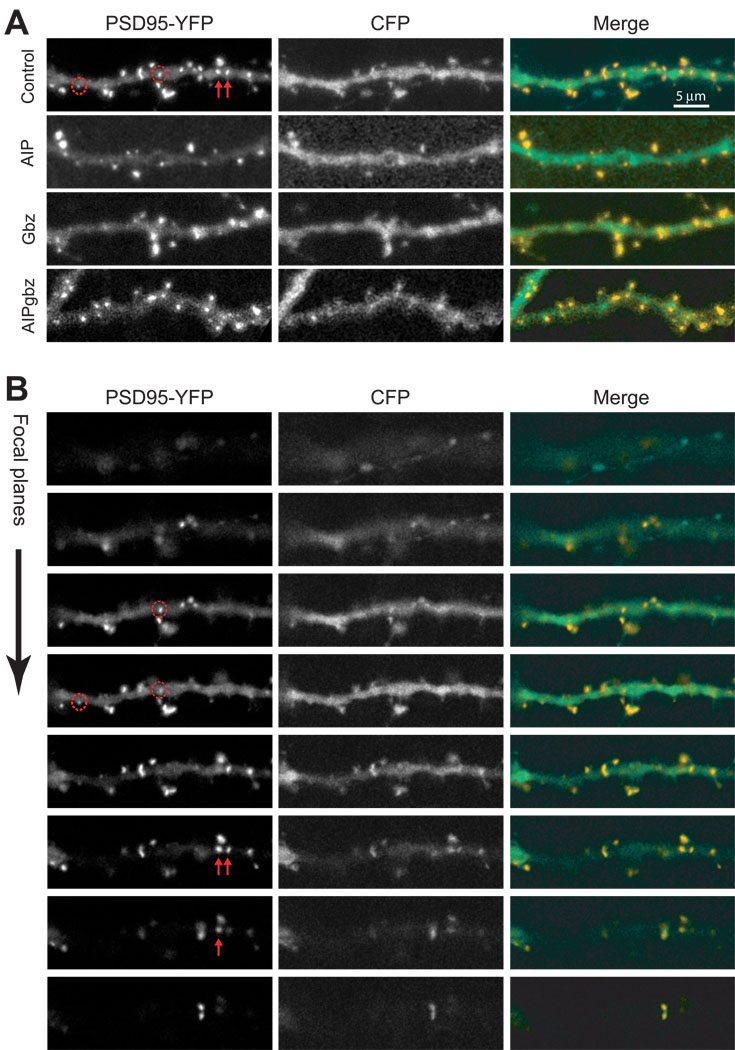
Figure 4. Representative images of PSD-95 clusters under different conditions.
Pyramidal neurons in hippocampal slice cultures were co-transfected with PSD95-YFP with either CFP or CFP-AIP and treated with control FCM or Gbz, as described in Methods. (A) Representative sets of 2D projection images showing a segment of dendrite under different conditions. The actual quantitation was done using 3D stacks. The left panel shows YFP fluorescence, the middle panel shows CFP fluorescence and the right panel shows the merged images with the YFP in yellow and the CFP in green. The red arrows and circles in the upper-left panel correspond to those in the panels in B and distinguish shaft (arrows) and spine (circles) PSDs. (B) The image stack used to construct the projection for control images shown in (A) is shown to demonstrate how spine and shaft PSDs were distinguished. For example, the red arrows and circles indicate four PSDs that all appear to be on the shaft in the 2D projection images in (A). Scrutiny of the entire image stack reveals the location of PSDs in the z-axis, revealing that the two PSDs identified by arrows are on dendritic shaft but the two circled PSDs are not in the same plane as the dendritic shaft but are on projections from the shaft and were consequently classified as spine PSDs.

