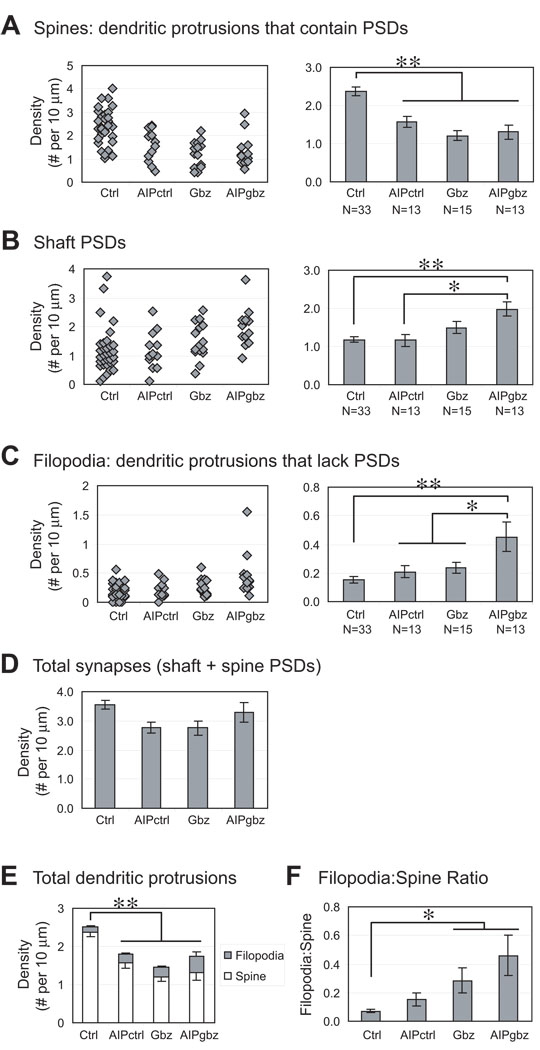
Figure 5. Quantification of spines, filopodia and shaft PSDs under control and EA condition.
Hippocampal slice culture and transfection were done as described in Figure 3. A-C show distribution and mean density of (A) spines (dendritic protrusions that contain PSDs); (B) shaft PSDs; and (C) filopodia (dendritic protrusions that lack PSDs). Each diamond represents the density of PSD-95 clusters in one neuron. All neurons from three separate experiments were pooled together. N = 33 (Ctrl); 13 (AIP); 15 (Gbz); 13 (AIPgbz). (D) Total PSDs (shaft + spine). (E) All dendritic protrusions counted: spines (white) or filopodia (gray). (F) Filopodia:Spine ratio calculated from data in A-C. Significant differences are indicated by * P < 0.05 or ** P < 0.01 (Student's t-test).

