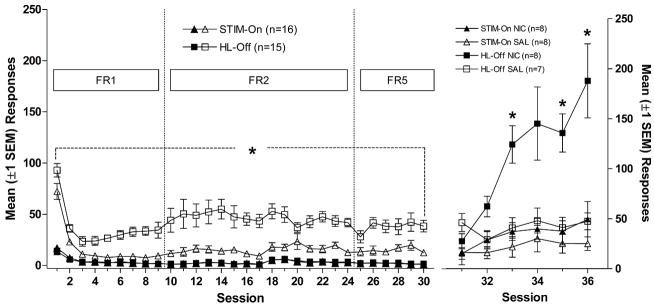
Figure 6.4.
Left panel shows the mean (±1 SEM) number of active- and inactive-lever responses made during the stimulus comparison phase. Active-lever responses were significantly higher in the House-Light off than the Lever-Light on condition. Right panel illustrates the mean (±1 SEM) active-lever responses made during nicotine/saline testing sessions. Active-lever responding in House-Light NIC condition was significantly greater than the House-Light Sal condition. The number of reinforcements earned in this study was previously reported in Palmatier et al. (2007).

