
Figure 1.
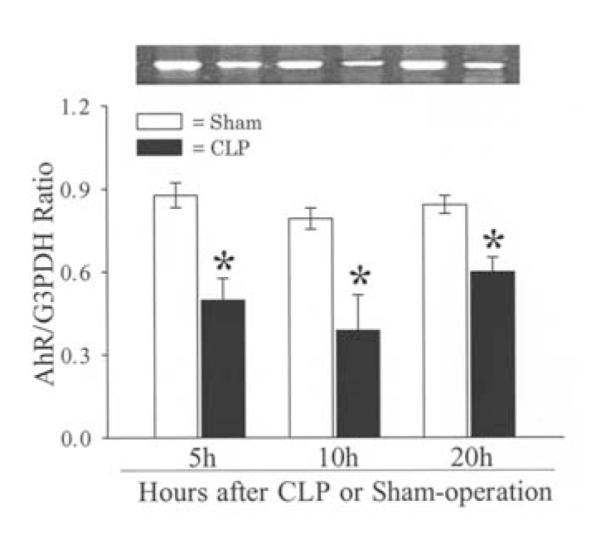
Alterations in gene expression of AhR in the rat liver at 5, 10 and 20 h after CLP or sham-operation. A representative blot is also shown. Data are presented as means ± SE (n=5-6/group) and were compared by one-way ANOVA and Tukey’s test; *P<0.05 versus respective shams.