
Figure 5.
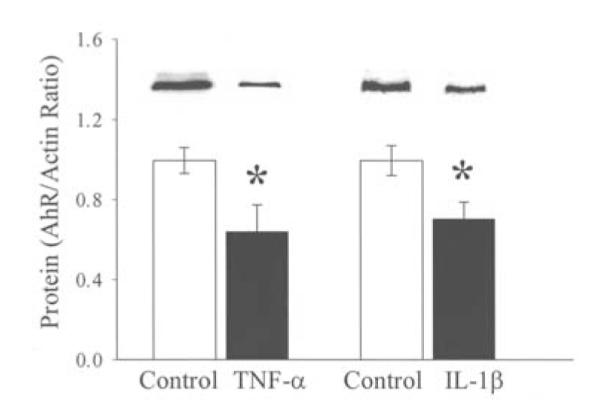
Alterations in AhR protein levels in hepatoma cell (H-4-II-E) culture stimulated with 5.0 ng/ml of TNF-α and 2.5 ng/ml of IL-1ß. Representative blots are also presented. Data are expressed as means ± SE (n=6/group) and were compared by one-way ANOVA and Tukey’s test; *P<0.05 versus controls.