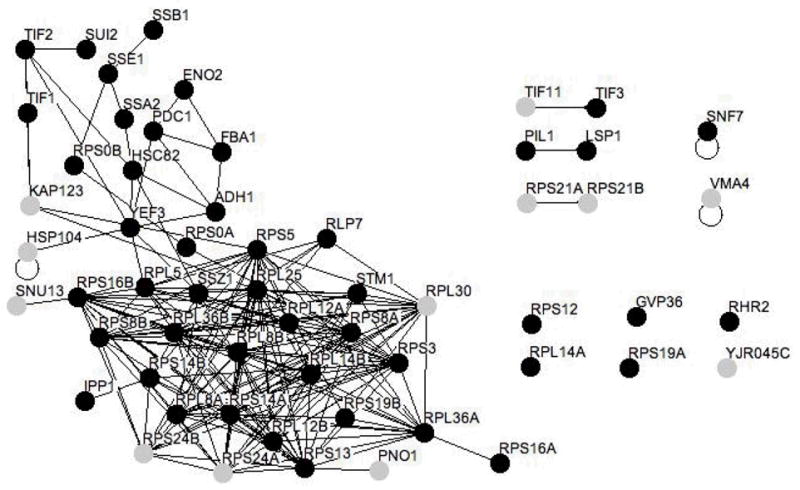
Figure 8. The majority of proteins in the <100 kDa sample are known phosphoproteins.

Phosphoproteins and phosphoprotein complexes were obtained by passing yeast extract over the Pro-Q Diamond resin. The sample was then separated by size using a 100 kDa centrifugal concentrator. The figure shows proteins found in the flow-through of the concentrator indicating a size smaller than 100 kDa. Figure 7 depicts the retentate, which should contain proteins and protein complexes larger than 100 kDa. Osprey software was used to generate a figure depicting all possible interactions within the sample, where each node represents a single protein 56. Proteins are represented by grey and black nodes where black nodes represent proteins previously reported to be phosphorylated (see Supplemental Table 3). Protein interactions within the entire retentate of the 100 kDa centrifugal concentrator were obtained from the BioGRID database (http://www.thebiogrid.org/) 13 and are indicated by solid lines.
