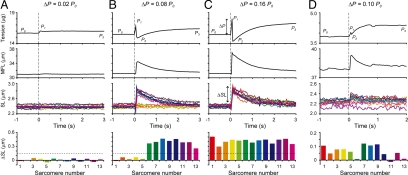
Fig. 2.
Responses of individual sarcomeres in a myofibril at various ΔP. The time course of tension (top), total length of the myofibril, MFL (upper middle), and length-responses of individual sarcomeres in a myofibril (SL, lower middle) under ΔP = 0.02 P0 (A), 0.08 P0 (B), 0.16 P0 (C), and 0.10 P0 (D) loading are shown. The loading rate was 0.02 P0/ms. Each SL is shown in a different color. The myofibril was stretched at time 0, shown by vertical dashed lines. P0 indicates the active isometric force before stretch, P1 is the peak force immediately after stretch, P2 is the minimum force due to “yielding” of sarcomeres, and P3 is the final plateau level. The spatial distributions of ΔSL of individual sarcomeres in the myofibril are shown in the bottom panels. Colors correspond to those in the SL traces. (A–C) Tension and length responses at ADP-activation. The data were obtained from the same myofibril and from the consecutive 13 out of 15 sarcomeres in the central part of the myofibril. The horizontal dashed line corresponds to ΔSL = 150 nm (see Fig. 3A). The cross-sectional area of the myofibril was determined to be 2.47 μm2. (D) Tension and length responses at partial Ca2+-activation (pCa = 6.3). The consecutive 13 out of 17 sarcomeres in the central part of the myofibril were analyzed. Note that different myofibrils were used in (A–C) and (D). The cross-sectional area, 2.68 μm2.

