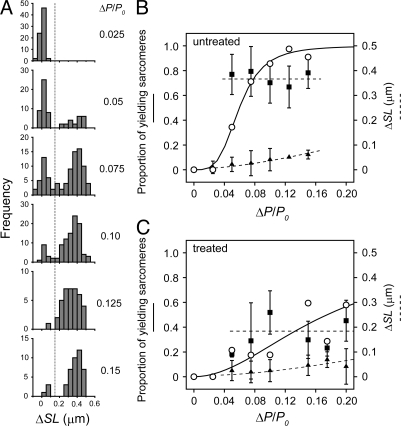
Fig. 3.
Bimodal sarcomere response depending on ΔP. (A) The distribution of ΔSL of individual sarcomeres at various ΔP. Each histogram is composed of the data obtained at a ΔP/P0 in the range of the central values (shown to the right of each histogram) ± 0.0125. The data were obtained from n = 8 myofibrils at the loading rate of 0.01–0.04 P0/ms. The vertical dashed line corresponds to ΔSL = 150 nm, which separates “resisting” and “yielding” sarcomeres. (B and C) The population and ΔSL of the bimodal response depending on ΔP. The proportion of “yielding” sarcomeres against ΔP/P0 (open circles) in untreated (n = 8 myofibrils) and antibody-treated (n = 5 myofibrils) preparations is shown in B and C, respectively. The solid curves are the fits to the Hill equation. The average ΔSL of “resisting” (filled triangles) and “yielding” (filled squares) sarcomeres are plotted with error bars (± SD). The dotted lines were drawn by eye.

