
Figure 3.
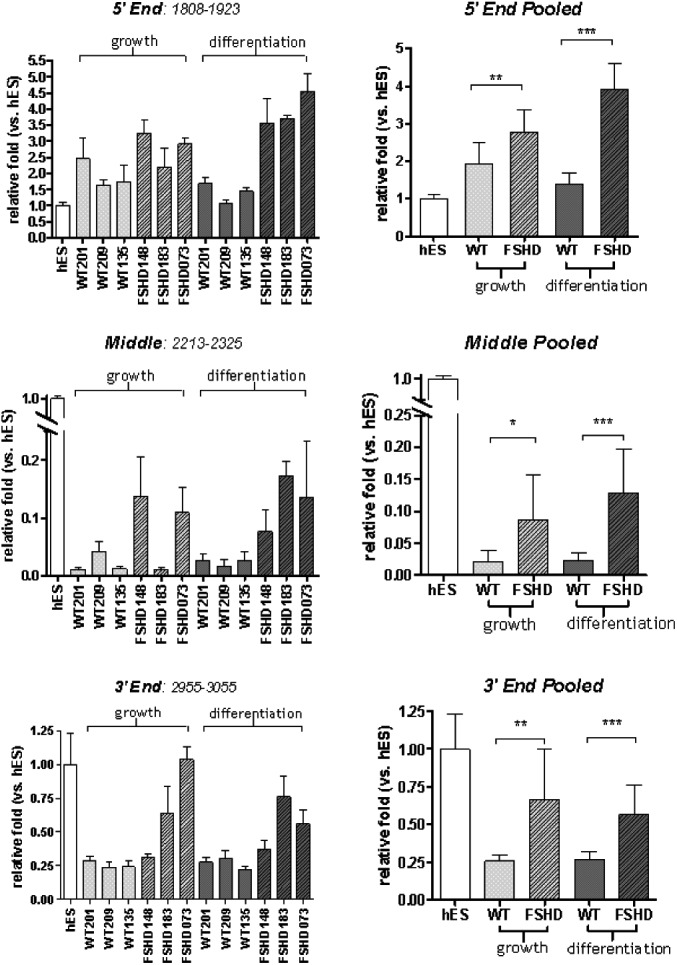
Quantification of amplification products from various DUX4 regions using real-time RT–PCR. RNA sources were cultured myoblasts and myotubes from control and FSHD-affected individuals, and human ES cells. In each grouping, the left panel shows the average of triplicate data from six independent muscle-derived cell cultures (three wild-type and three FSHD) under growth (myoblast) and differentiation (myotube) conditions and the right panel shows the combined average values for wild-type and FSHD with values expressed as the amount relative to the RNA abundance in ES cells. Note that amplification products from the 5-prime region of the DUX4 transcript are slightly more abundant in muscle cells when compared with ES cells; however, amplification products from the middle region of DUX4 are much less abundant in muscle cells. Amplification products from the 3-prime region of DUX4 are less abundant when RNA from muscle is compared with that from ES cells but increased in quantity when compared with the middle region. Error bars indicate standard deviation and asterisks indicate: *P < 0.01; **P < 0.001; ***P < 0.0001; however, the biological significance should be interpreted cautiously due to the small number of independent samples. See Supplementary Material, Table S2 for RT and PCR primer sequences.