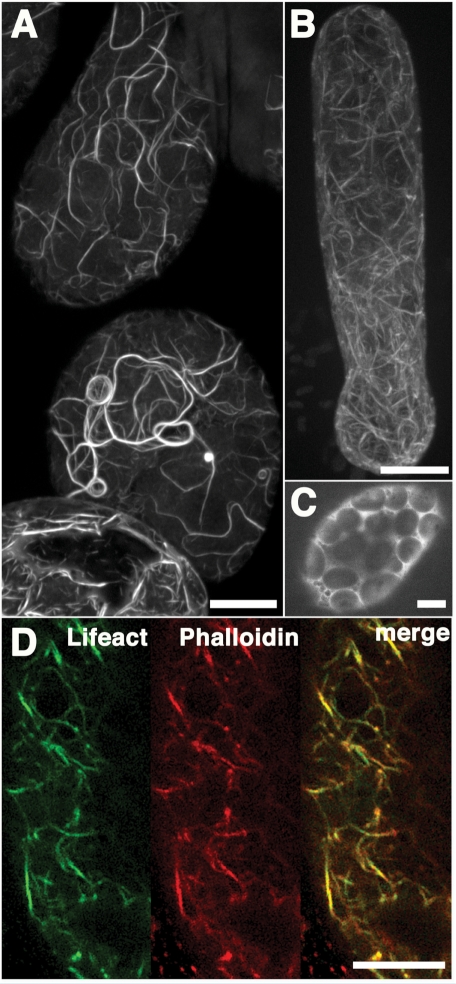
Fig. 4.
Actin filaments in M. polymorpha visualized by Lifeact–Venus. (A) Maximum intensity projection images of actin filaments in epidermal cells of thallus and (B) young rhizoid obtained using a spinning-disk confocal microscope. (C) Thallus cells expressing Lifeact–Venus were treated with bistheonellide A. (D) Actin filaments in thallus cells expressing Lifeact–Venus were stained with phalloidin conjugated to Alexa Fluor 568. Lifeact–Venus and phalloidin co-localized. Scale bars = 10 μm.

