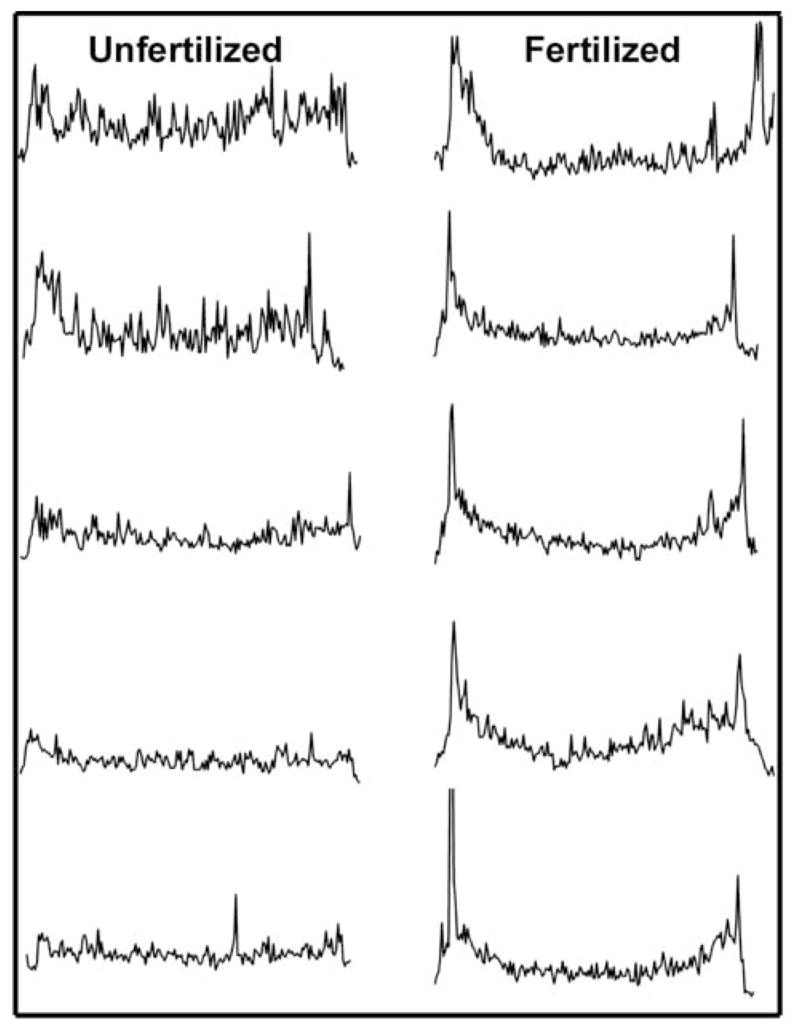
Figure 2. Changes in the relative distribution of P-Tyr in response to fertilization.

In order to demonstrate the effect of fertilization on the distribution of P-Tyr residues, transverse linescan analysis was performed on images from eggs and zygotes labeled with the anti-P-Tyr antibody as in Figure 1. Measurements lines were drawn originating from a point adjacent to the meiotic spindle and passing through the center of the egg to the opposite side. Pixel intensity along the course of the lines is presented in the vertical axis. Measurements made from representative unfertilized eggs are presented on the left and those made from different stages of zygote development up to the pronuclear stage.
