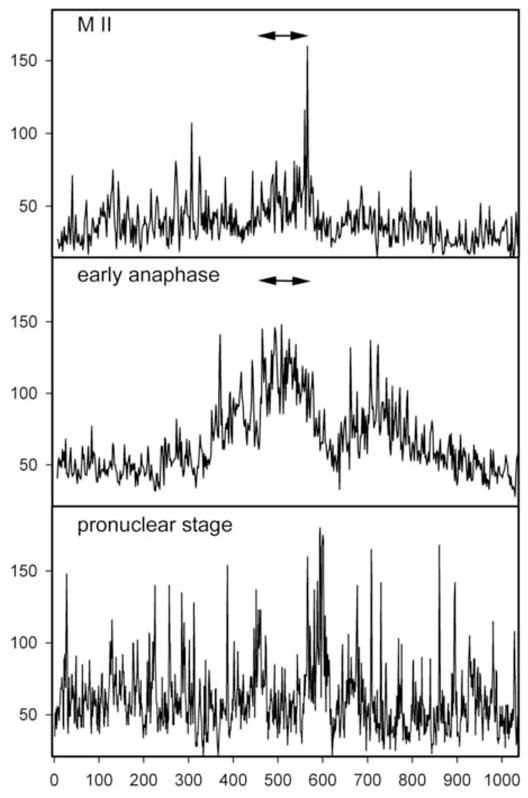
Figure 3.

Distribution of P-Tyr-containing proteins in the egg cortex. In order to demonstrate the asymmetric distribution of P-Tyr in the egg cortex, the fluorescence intensity of eggs and zygotes labeled with the anti-P-Tyr antibody as in Figure 1, was quantitated by circumferential linescan analysis using Metamorph 6.2 and is indicated on the vertical axis. A measurement line was traced on images beginning from a position at the egg surface opposite the meiotic spindle and progressed clockwise around the egg cortex to include the entire cortex (horizontal axis). The position of the spindle is therefore near the center of each scan and is indicated by the arrows.
