
Figure 1. Syngeneic subcutaneous tumor growth is increased in the absence of selectins.
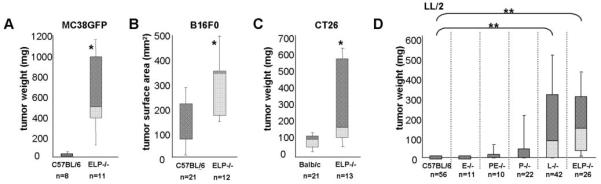
5×10⁴ MC38GFP colon carcinoma (A) or 1×10⁴ B16F0 melanoma (B) syngeneic to C57BL/6, 1×10⁴ CT26 colon carcinoma syngeneic to Balb/c (C), or 1×10⁴ Lewis lung carcinoma (LL/2) syngeneic to C57BL/6 (D), cells were injected subcutaneously into the flank of either control mice or mice lacking selectins. Three weeks after injection, tumors were dissected out and weighed. Where dissection was difficult, tumor growth was assayed by measuring tumor surface area instead of weight (B). Tumor incidence is reported as % mice with tumors out of total mice of the given genotype that were assayed (n). The weights or sizes of the tumors are displayed as box-whisker plots, the central line denoting the mean, the shaded gray boxes and the lines denoting the 90th, 75th, 25th, and 10th percentiles.
*, p<0.05 by two-tailed Student’s t test
**, p<0.0005 two-tailed Student’s t test and p<0.005 by chi2 analysis