
Figure 5. NK cells, but not adaptive immune cells, suppress subcutaneous tumor growth.
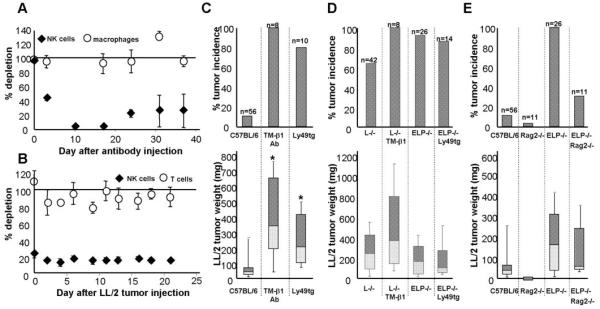
A. As measured by the % NK1.1+/CD3- cells in the blood, mice injected with TM-β1 NK-depleting antibody (1 mg/mouse i.p.) selectively lose NK cells but not macrophages as compared with mice treated with the same dose of an isotype control antibody. NK cell numbers decrease from 3*106 circulating NK cells/mouse on day 0 to 1.2*106 NK cells on day 3 to 6*104 NK cells by day 10 after antibody treatment. B. Similarly, Ly49A-GrzAtg+ mice that are genetically deficient in NK cells, as compared with tg- littermates, remain depleted of NK cells (∼5*105 circulating NK cells/mouse) even after 3 weeks of tumor challenge, while T cells are unaffected. Results are expressed as % NK cells in NK-depleted animals as compared with the appropriate controls ± SEM. Tumor weight was assayed 3 weeks after injection of 1×10⁴ LL/2 cells into: C. C57BL/6 mice depleted of NK cells, either pharmacologically by TM-β1 antibody injection 3 days prior to tumor cell transfer, or genetically in Ly49tg+ mice; D. selectin-deficient mice depleted of NK cells; or E. lacking the adaptive immune system (Rag2-/-). Tumor incidence is reported as % mice with tumors out of total mice of the given genotype that were assayed (n). The weights or sizes of these tumors that grew are displayed as box-whisker plots, the central line denoting the mean, the shaded gray boxes and the lines denoting the 90th, 75th, 25th, and 10th percentiles; plotted below are the corresponding tumor incidences.
*, p<0.05 by two-tailed Student’s t test.