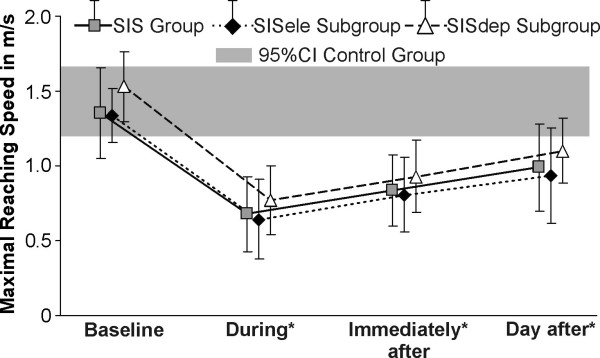
Figure 3.
Maximal hand speed (in m/s) during reaching. The maximal hand reaching speed (mean and standard deviation) observed before (baseline), during, immediately after and the day after training with feedback is shown. The grey band represents the 95% confidence interval (95%CI) of the control group. * Significant difference in the group/subgroups with SIS compared to their baseline trials (E1).

