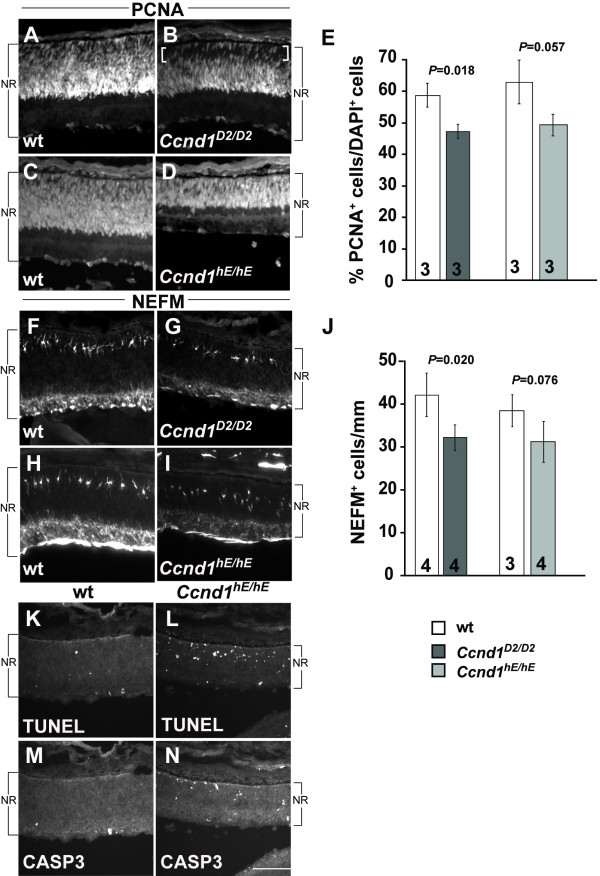
Figure 9.
Analysis of Ccnd1D2/D2 and Ccnd1hE/hE retinas at P0. (A-D) Expression pattern of PCNA) in Ccnd1D2/D2 retina (B), Ccnd1hE/hE retina (D) and their respective wild-type (wt) controls (A, C) is shown. (E) Quantification of proportions of PCNA+ cells. (F-I) Expression pattern of NEFM in Ccnd1D2/D2 retina (G), Ccnd1hE/hE retina (I) and their respective wild-type controls (F, H) is shown. (J) Quantification of NEFM+ cells. (K, L) TUNEL labeling in wild-type (K) and Ccnd1hE/hE retina (L). (M, N) Activated CASP3 immunoreactivity in wild-type (M) and Ccnd1hE/hE retina (N). Brackets in (B) show the 'apical gap' in the P0 Ccnd1D2/D2 retina. Abbreviations: NR, neural retina. Scale bar: 100 μm (N is representative for all panels).

