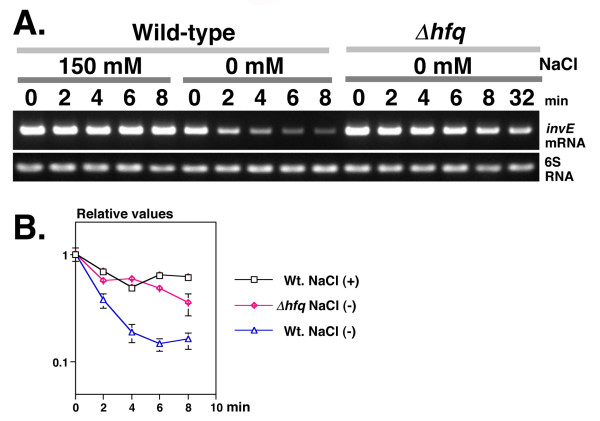
Figure 4.
A. Stability of invE mRNA in low osmotic growth conditions. Pre-cultures were inoculated into 35 ml of fresh YENB media and then grown at 37°C with shaking. When cultures reached an A600 of 0.8, rifampicin was added, then cells were harvested at 2 min intervals. Total RNA (100 ng) was used for RT-PCR analysis, and 10 μl of the amplified product was subjected to agarose gel electrophoresis. NaCl concentration (150 mM, 0 mM), strains (Wild-type strain MS390; Δhfq, MS4831) and time after rifampicin treatment (0, 2, 4, 6, 8, or 32 min) are indicated above the panels. Primers used in the experiments are indicated on the right side of the panels. B. Decay curves of invE mRNAs. Total RNA (100 ng) was subjected to real-time PCR analysis. The amount of RNA was normalized to an internal control (6S RNA) and expression was expressed relative to expression at time 0, which was set as 1.0. The X-axis indicates time after rifampicin treatment (0 to 8 min). Presence or absence of 150 mM NaCl (plus, minus) and strains (Wt, wild-type strain MS390; Δhfq, MS4831) are indicated on the right side of the graph.

