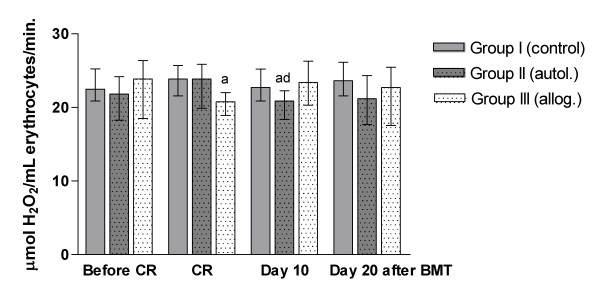
Figure 1.
Erythrocyte catalase (CAT) activity over time. CR: conditioning regimen; BMT: bone marrow transplantation. Data are expressed as median (lower/upper quartile). Group I (n = 37); Group II (n = 13); Group III (n = 24).a Significantly different from group I (control), dsignificantly different from CR.

