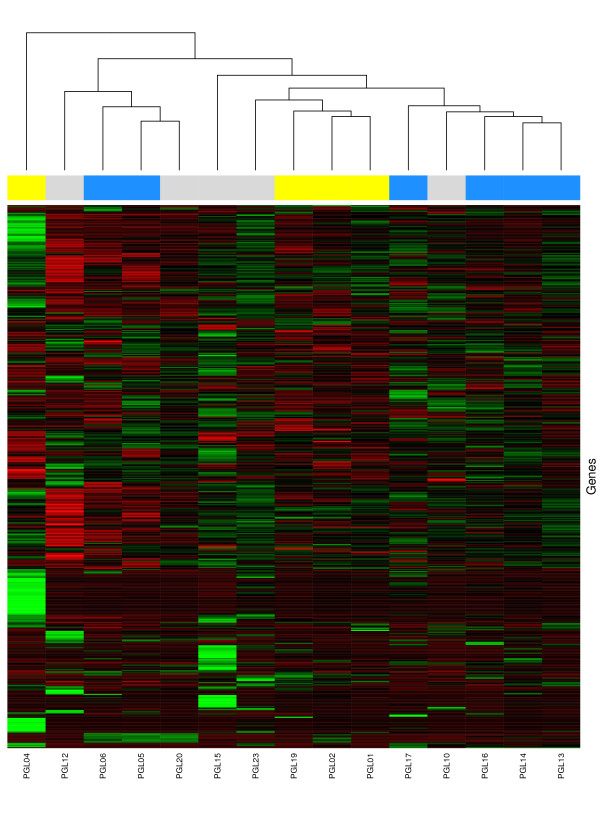
Figure 1.
Two way hierarchical clustering analysis of genetically defined paraganglioma subgroups. Two way hierarchical clustering of PGL2-linked (yellow squares in the top row), SDHD-linked (blue squares in the top row), and sporadic (grey squares in the top row) head and neck paragangliomas. Samples are represented as columns and genes as rows. Expression levels are normalized for each gene. The mean is zero, and the color scale indicates the expression of the gene relative to the mean. Red indicates high expression, black indicates mean expression, and green indicates low expression levels. Overall gene expression is very similar for all samples, no well defined sample clusters can be found.

