
Figure 3.
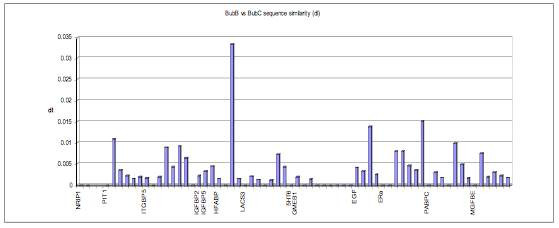
Plot of sequence similarity (dI) for genes in chromosomal order between BubB (River buffalo) and BubC (Swamp buffalo), showing high degrees of similarity over large regions of chromosomes 1 and 2.
Official websites use .gov
A
.gov website belongs to an official
government organization in the United States.
Secure .gov websites use HTTPS
A lock (
) or https:// means you've safely
connected to the .gov website. Share sensitive
information only on official, secure websites.
Plot of sequence similarity (dI) for genes in chromosomal order between BubB (River buffalo) and BubC (Swamp buffalo), showing high degrees of similarity over large regions of chromosomes 1 and 2.