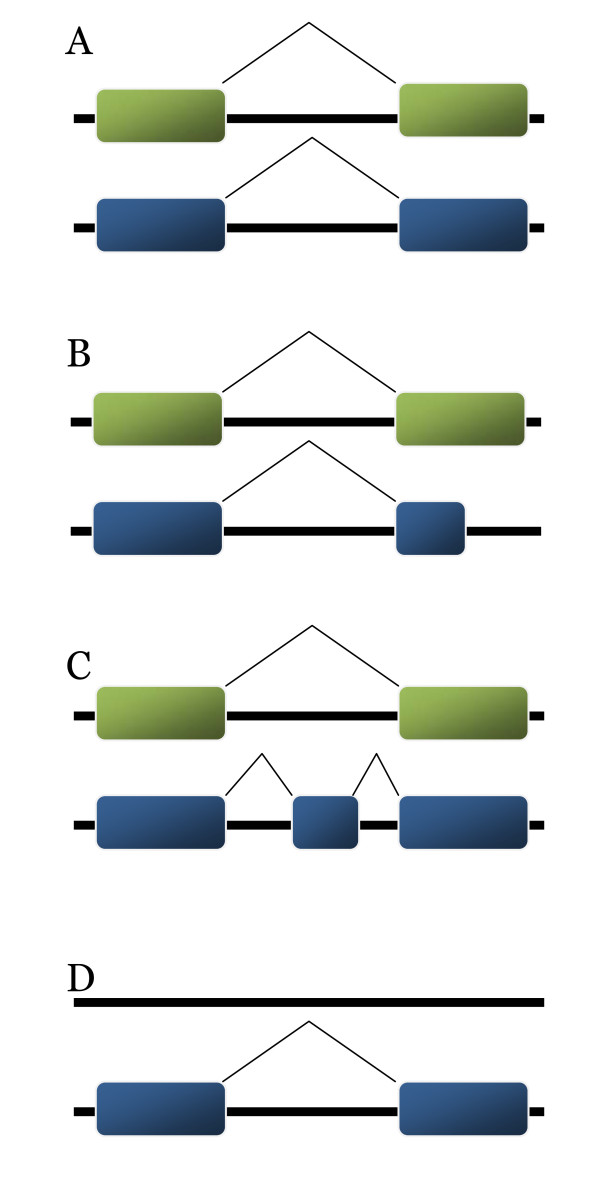
Figure 1.
Diagram of four classes of gene level interval overlaps. Interval overlap analysis identifies four classes of predictions between the two catalogs. Grey tracks represent identical stretches of the genomic assembly. Either blue or green boxes distinguish exons in the two catalogs. (A) Predictions are exact overlaps; (B) Predictions show a partial gene overlap with an exact overlap of the 5' exon and partial overlap of the 3' exon; (C) Predictions show a partial gene overlap with an exact overlap of the terminal exons and an extra exon in one catalog but not the other; (D) A unique prediction present in one catalog but not present in the other catalog.

