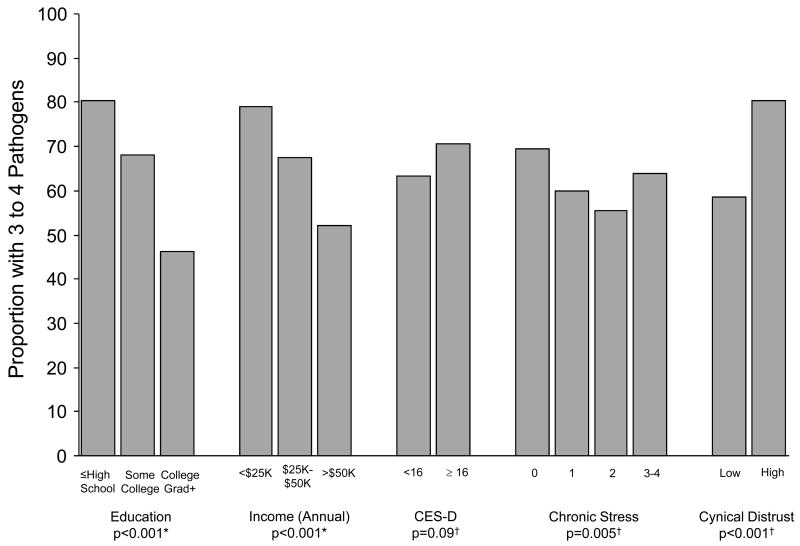
Figure 1. Percent of persons with 3–4 pathogens by socioeconomic and psychosocial factors in a subset (n=999) of the Multi-ethnic Study of Atherosclerosis (July 2000 — July 2002).
Depressive symptoms were defined as CES-D ≥ 16 versus < 16, chronic stress is presented categorically with level 0 representing no chronic stress, and high cynical distrust was defined as a score of ≥ 5 versus < 5 based on the median value in the study population. *P-values were computed using trend tests. † P-values were computed using Chi-squared tests.

