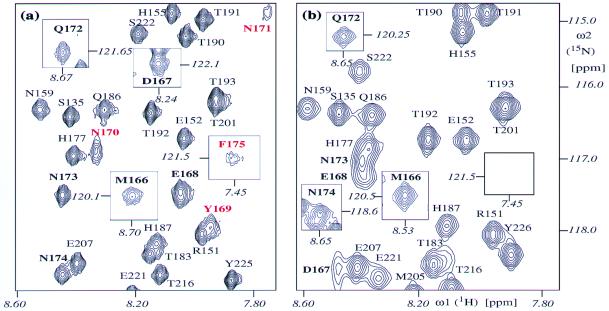
Figure 2.
Two-dimensional [15N,1H]-COSY spectra. (a) hPrP(S170N). (b) hPrP(121–230). A spectral region is shown that contains most of the resonances of the loop 166–172 in hPrP(S170N). The following notation is used for the peak assignments: Cross peaks detected in both proteins are black. Cross peaks present only in hPrP(S170N) are red. Cross peaks belonging to residues 166–175 are bold. The rectangular frames display cross peaks outside of the region shown here, with the chemical shifts of the peaks indicated in italics. The spectra were recorded at 600 MHz with 1 mM protein solutions at pH 4.5 and 20°C.

