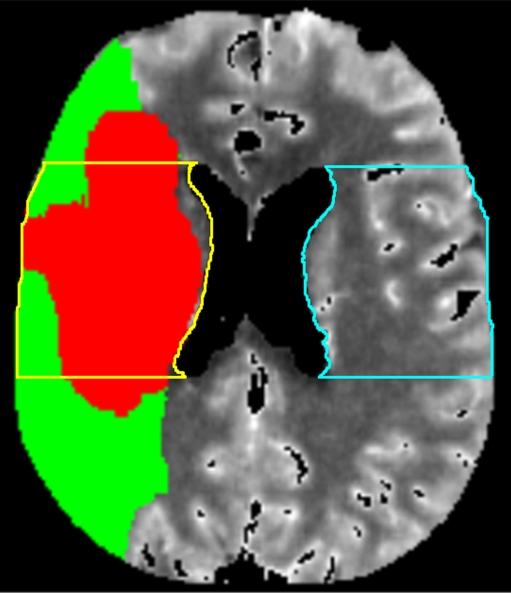
Fig. 1.
Axial PCT map depicting the area of infarct core (red) and tissue at risk (green) in the right MCA territory. Also demonstrated are the regions of interest (ROIs) that were systematically drawn for all post-processing rounds in the MCA territory of the ischemic (yellow) and contralateral hemisphere (blue). Mean values of CBV, CBF and MTT measured in these ROIs were recorded

