Fig. 5.
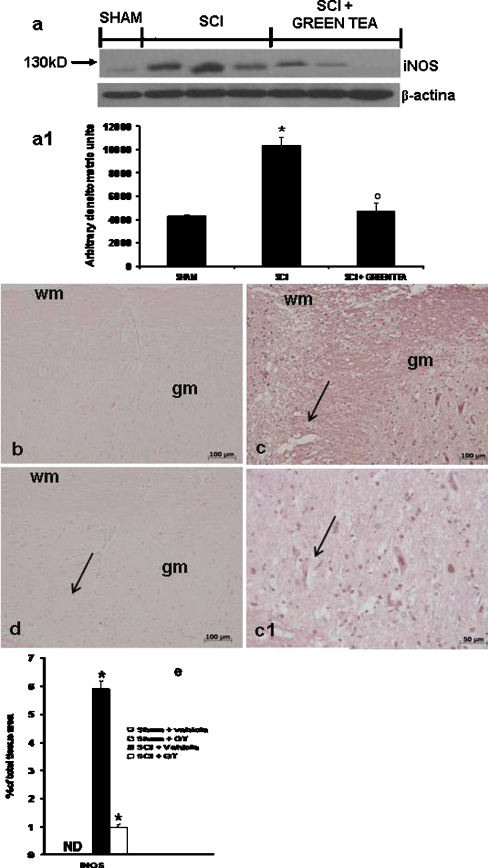
Effects of GTE on iNOS expression. iNOS expression was evaluated by both Western Blot analysis and immunohistochemical analysis. By Western blot analysis, a basal level of iNOS was detected in the spinal cord from Sham-operated mice (a, a1). iNOS levels were appreciably increased in the spinal cord from control mice subjected only to SCI. On the contrary, green tea treatment prevented the SCI-induced iNOS expression (a, a1). In addition, iNOS expression was also evaluated by immunoistochemical analysis in the spinal cord section 24 h after SCI. Spinal cord section from sham-operated mice did not stain for iNOS (b), whereas spinal cord section obtained from SCI-operated mice exhibited positive staining for iNOS (c, c1) mainly localised in various inflammatory cells in the gray matter. GTE treatment reduced the degree for positive staining for iNOS in the spinal cord tissue (d). Densitometry analysis of immunocytochemistry photographs (n = 5 photos from each sample collected from all mice in each experimental group) for iNOS (e) from spinal cord tissues was assessed. The assay was carried out by using Optilab Graftek software on a Macintosh personal computer (CPU G3-266). Data are expressed as percent of total tissue area. wm white matter, gm gray matter. This figure is representative of at least three experiments performed on different experimental days. *p < 0.01 vs. Sham. Degree symbol p < 0.01 vs SCI+vehicle

