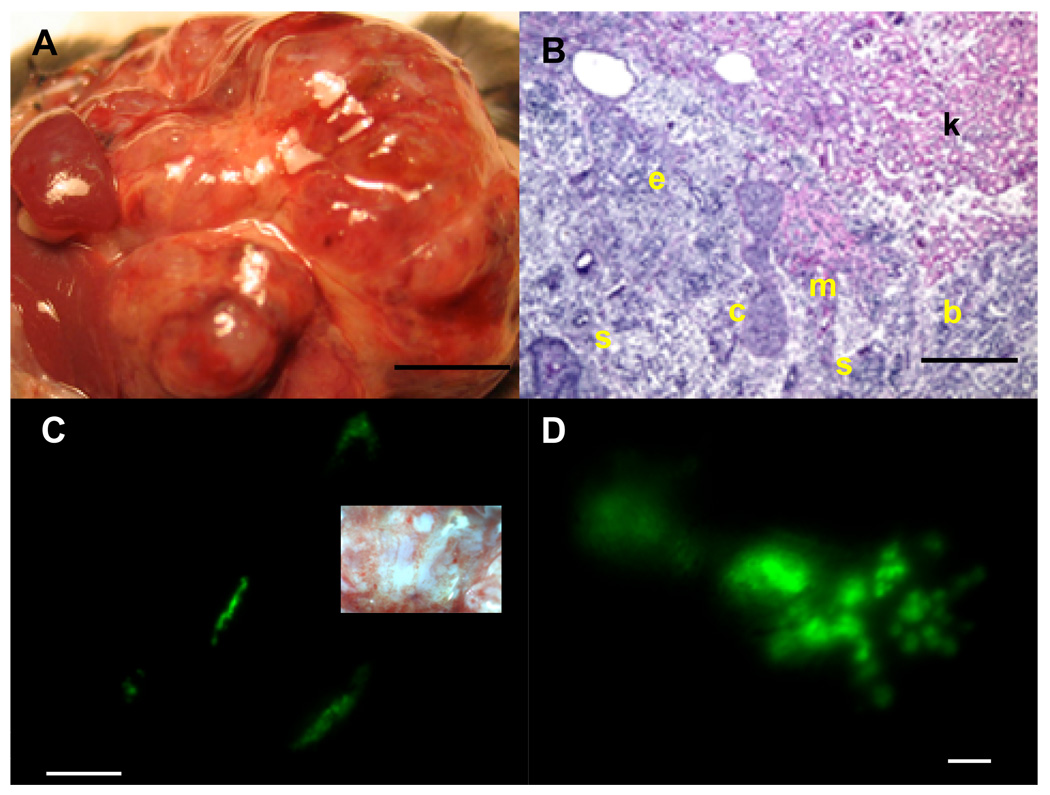
Fig. 1. Formation of teratomas following transplantion of MIP-GFP ESCs under the kidney capsule.
A: Solid teratoma present 4-wk after transplantation. S: host spleen; L: host liver. Scale bar is 1 mm. B: Typical teratoma including mucosal epithelial cells (e), cartilage (c), muscle (m), squamous cells (s) and brain tissue (b). Note invasion of teratoma into host kidney tissue (k). C: GFP-expressing cells appear in clusters in the teratoma. Scale bar is 1 mm. Inset shows same area in bright field. Scale bar is 1 mm. D: Some GFP-expressing clusters show a distinct branching pattern. Scale bar is 100 µm.

