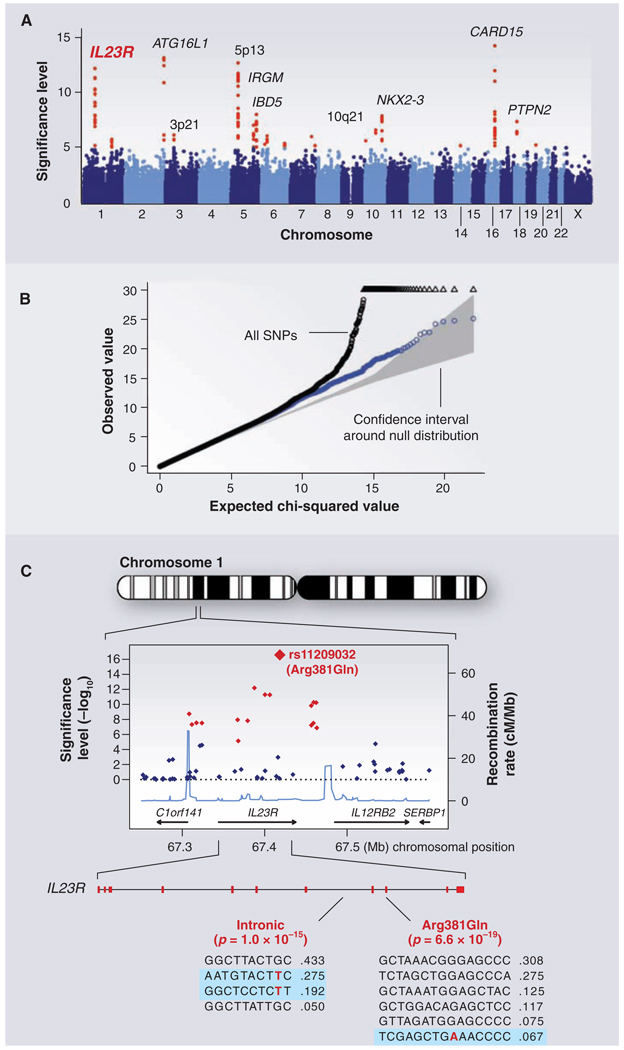
Fig. 3.
GWAS for Crohn's disease. The panels show data from the study of Crohn's disease by the Wellcome Trust Case Control Consortium. (A) Significance level (P value on log10 scale) for each of the 500,000 SNPs tested across the genome. SNP locations reflect their positions across the 23 human chromosomes. SNPs with significance levels exceeding 10−5 (corresponding to 5 on the y axis) are colored red; the remaining SNPs are in blue. Ten regions with multiple significant SNPs are shown, labeled by their location or by the likely disease-related gene (e.g., IL23R on chromosome 1). (B) The fact that the SNPs in red are extreme outliers is made clear from a so-called Q-Q plot. A Q-Q plot is made as follows: The SNPs are ordered (from 1 to n) according to their observed P values; observed and expected P values are plotted for each SNP. Under the null distribution, the expected P value for the ith SNP is i/n. If there are no significant associations, the Q-Q plot will lie along the 45° line; the gray region corresponds to a 95% confidence region around this null expectation. Black points correspond to all 500,000 SNPs studied that passed strict quality control; they diverge strongly from the null expectation. Blue points reflect the P values that remain when the SNPs in the 10 most significant regions are removed; there is still some excess of significant P values, indicating the presence of additional loci of more modest effect. (C) Close-up of the region around the IL23R locus on chromosome 1. The first part shows the significance levels for SNPs in a region of ~400 kb, with colors as in (A). The highest significance level occurs at a SNP in the coding region of the IL23R gene (causing an Arg381 → Gln change). The light blue curve shows the inferred local rate of recombination across the region. There are two clear hotspots of recombination, with SNPs lying between these hotspots being strongly correlated in a few haplotypes. The second part shows that the IL23R locus harbors at least two independent, highly significant disease-associated alleles. The first site is the Arg381 → Gln polymorphism, which has a single disease-associated haplotype (shaded in blue) with frequency of 6.7%. The second site is in the intron between exons 7 and 8; it tags two disease-associated haplotypes with frequencies of 27.5% and 19.2%.

