
Figure 4.
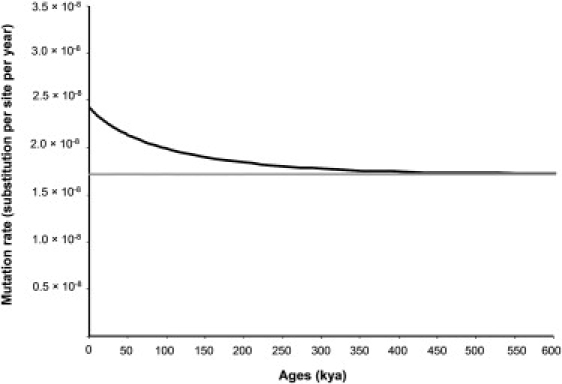
Variation of the mtDNA Mutation Rate through Time
The black curve represents the mtDNA mutation rate. The gray curve represents the interspecific mutation rate.
Official websites use .gov
A
.gov website belongs to an official
government organization in the United States.
Secure .gov websites use HTTPS
A lock (
) or https:// means you've safely
connected to the .gov website. Share sensitive
information only on official, secure websites.
Variation of the mtDNA Mutation Rate through Time
The black curve represents the mtDNA mutation rate. The gray curve represents the interspecific mutation rate.