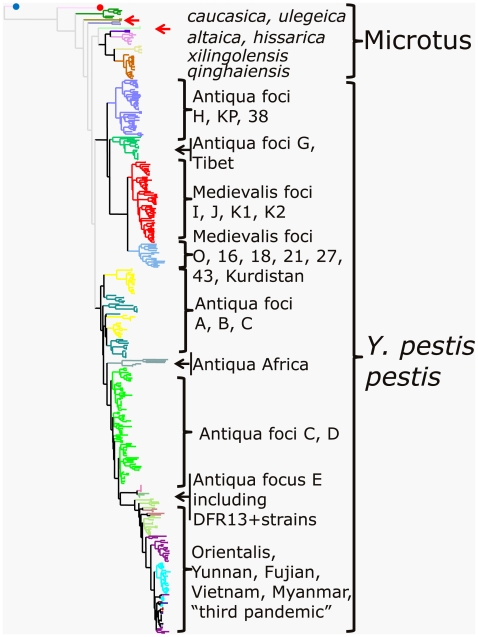
Figure 1. Dendrogram based on the 25 VNTR loci.
Clustering analysis was done using the categorical distance coefficient and the Neighbor-Joining clustering method. The Y. pseudotuberculosis representative (blue dot) was chosen as outgroup to root the tree. Red dot, Angola isolate. Red arrows, Y. pestis subsp. pestis isolates with exceptional genotypes. The branches color code is as indicated in legends from Figure 2 and Figures S1, S2, S3.

