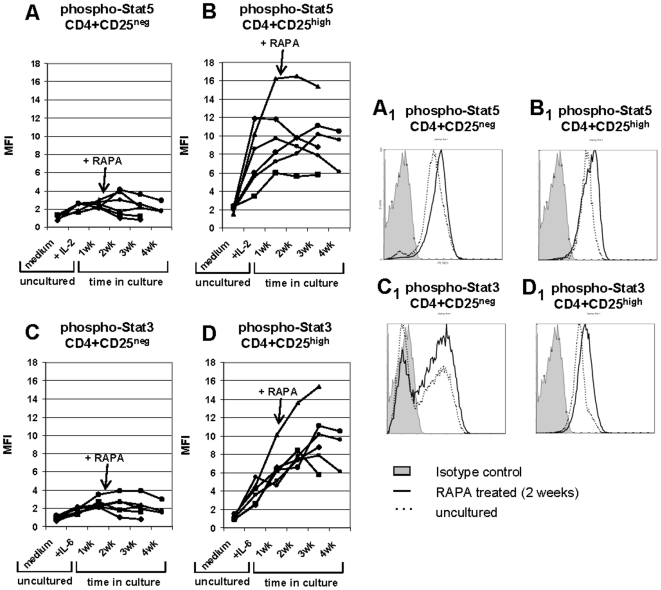
Figure 7. Activation of STAT5/3 proteins in fresh (untreated) and RAPA-expanded CD4+CD25neg and CD4+CD25high T cells.
Mean fluorescence intensity (MFI) of phosphorylated STAT5 in CD4+CD25neg in A, and CD4+CD25high T cells in B and of phosphorylated STAT3 in CD4+CD25neg in C and CD4+CD25high T cells in D. PBMC-derived T cells were sorted into CD4+CD25neg and CD4+CD25+ populations and tested by flow cytometry immediately after isolation and after culture in the presence of 1 nM RAPA (at baseline unstimulated, in medium) or were briefly stimulated with 150 IU/mL IL-2 (A and B) or with 150 IU/mL IL-6 (C and D) just before analysis. In addition, T cells were cultured for the indicated periods of time and stimulated with IL-2 and IL-6 just before flow cytometry analysis. The gate was set on CD3+CD4+CD25neg or CD3+CD4+CD25high T cells, respectively. RAPA was added to T-cell cultures at the indicated concentrations. Data obtained with T cells of 6 NC are shown. Fold expansion and percent suppression mediated by these cells are shown in Table 4 .

