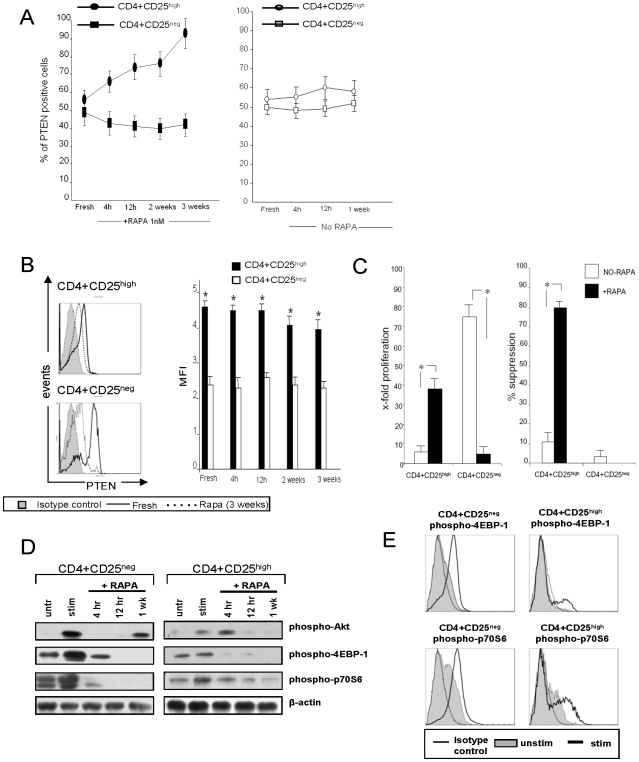
Figure 8. PTEN expression and signaling in fresh and RAPA-expanded CD4+CD25high and CD4+CD25neg T cells.
A. Percentages of PTEN+ cells tested fresh (no RAPA) or after culture +RAPA for the indicated time periods. B. The MFI for PTEN expression in fresh and RAPA-expanded T cell cultures. C. Fold expansion and % suppression mediated by the same CD4+CD25high and CD4+CD25high T cell subsets cultured±RAPA on week 3. The data in A–C are means±SD from 6 experiments with cells of normal donors. Asterisks indicate significant differences between CD4+CD25high and CD4+CD25neg cells at p<0.001. C. Results of Western blots comparing expression levels of phospho-Akt, phospho-4EBP-1 and phospho-p70S6 in CD4+CD25high and CD4+CD25neg T cell subsets±RAPA. T cells were either unstimulated or stimulated with bead-coated anti-CD3/CD28 Abs and 100 IU/mL of IL-2 for 2 h and cultured in the presence of RAPA for the indicated time periods. The cells were harvested and used for Western blots. D. Flow cytometry histograms showing expression of phospho-4EBP-1 and phospho-p70S6 in freshly-isolated CD4+CD25high and CD4+CD25neg T cells subsets. Cells were stimulated as described above for 24 h and cultured in the presence of RAPA. They were harvested, permeabilized, stained and examined by flow ctyometry. Results are from one out of 3 experiments performed.

