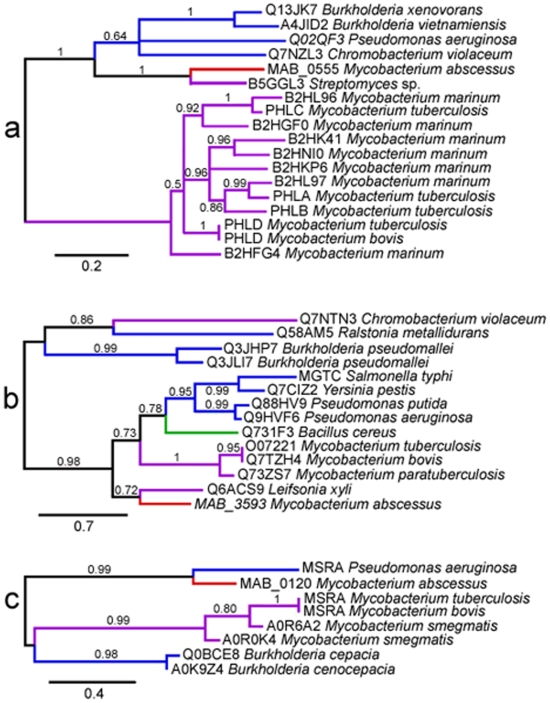
Figure 5. Phylogenetic trees (maximum likelihood) of PlC (a), MgtC (b) and MsrA (c) proteins.
Branch supports values are indicated at the nodes. Branch colors indicate proteins from M. abscessus (red), Actinobacteria (purple), Proteobacteria (blue) and Firmicutes (green). Labels at the leaves show the Uniprot identifier of the proteins and the species they belong to.

