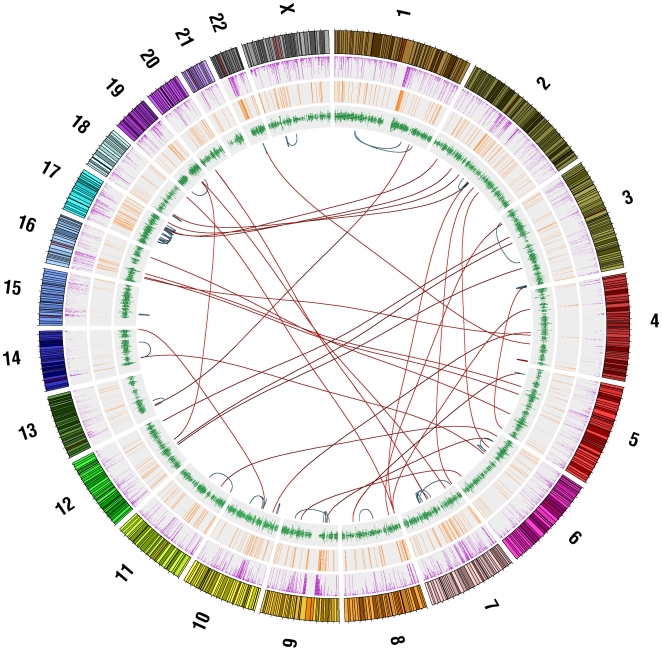
Figure 4. Visualization of gibbon rearrangements relative to the human genome.
This visualization was generated using Circos software (http://mkweb.bcgsc.ca/circos/). The lines in the inner circle represent inter-chromosomal (red) and intra-chromosomal (blue) rearrangements in gibbon relative to human. The outer circles provide genomic context. The outermost circle displays human chromosomes along with genomic coordinates and G-banding stains (NCBI Build 36.1). Purple lines represent human segmental duplications from the UCSC Segmental Dups Track. (http://genome.ucsc.edu/cgi-bin/hgTrackUi?g=genomicSuperDups). Orange lines represent gibbon segmental duplications we predicted based on read coverage. Green lines represent human genes from the UCSC RefSeq Genes Track (http://genome.ucsc.edu/cgi-bin/hgTrackUi?g=refGene.

