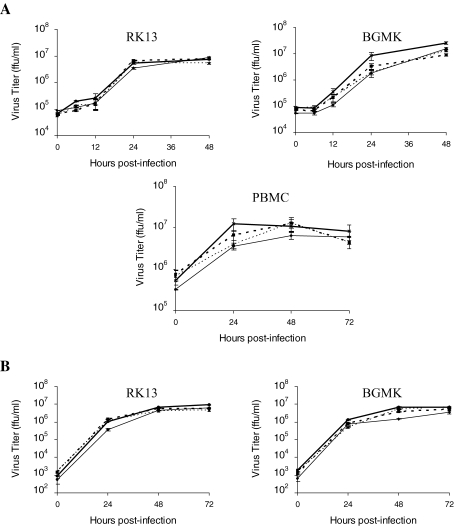
Figure 4.
Growth kinetics of wild-type and mutant viruses. (A) To evaluate viruses in vitro replication, cell lines (RK13 and BGMK) and primary cells (PBMC) were respectively infected at m.o.i. 4 and m.o.i. 1, with wild-type MYXV (thin solid line (□)), MYXV-ΔM148R (bold dashed line (■)), MYXV-ΔM149R (thin dashed line (▲)) or MYXV-ΔM148RΔM149R (bold solid line (×)). Virus titers were determined at different times p.i. on RK13 cells. Results are shown as means ± SEM (triplicate). (B) To examine virus spread, cells were infected at a low m.o.i. (m.o.i. = 0.01). Virus titers were determined at different times p.i. as indicated above. Results are shown as means ± SEM (duplicate).

