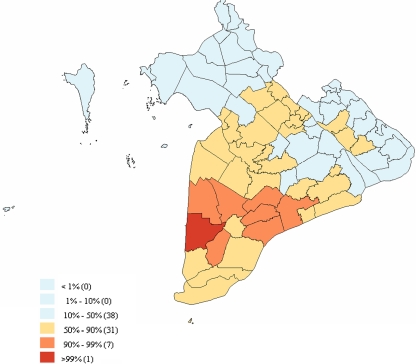
Figure 2.
Incidence rate of HPAI outbreak occurrence at district level for the 2006/2007 HPAI outbreak period in the Mekong Delta of Viet Nam. Incidence rates were calculated using spatial empirical Bayesian neighbourhood adjustment. The legend shows categorized percentiles of the incidence rates with the number of districts in each percentile category listed in brackets. (A color version of this figure is available at www.vetres.org.)

