Fig. 5.
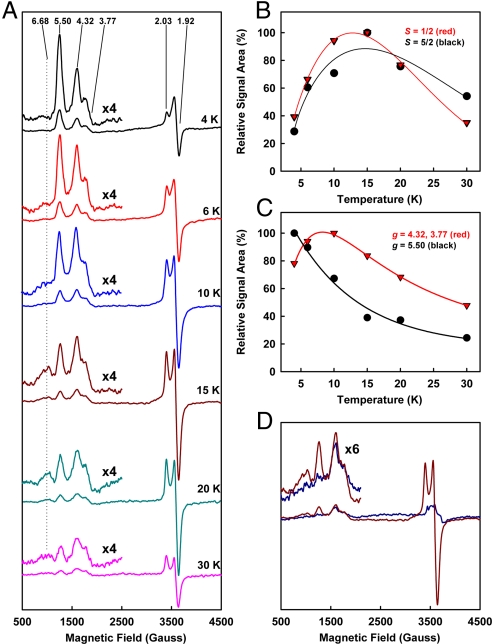
Temperature-dependent and redox-associated changes of EPR signals of VFe protein. (A) Variation of the EPR signals of dithionite-reduced VFe protein with increasing temperature. The S = 5/2 and 3/2 regions are enlarged and shown in the Insets. The g values of all signals are indicated. (B) Similarity in temperature dependency between the S = 1/2 (red) and 5/2 (black) signals. (C) Difference in temperature dependency between the combined feature at g = 4.32 and 3.77 (red) and the feature at g = 5.50 (black) of the S = 3/2 signal. (D) EPR spectra of VFe protein in dithionite-reduced (brown) and IDS-oxidized (blue) states. Upon IDS oxidation, the S = 5/2 and 1/2 signals and the g = 5.50 feature of S = 3/2 signal decrease in intensity; whereas the g = 4.32 and 3.77 features of S = 3/2 signal remain largely unchanged.

