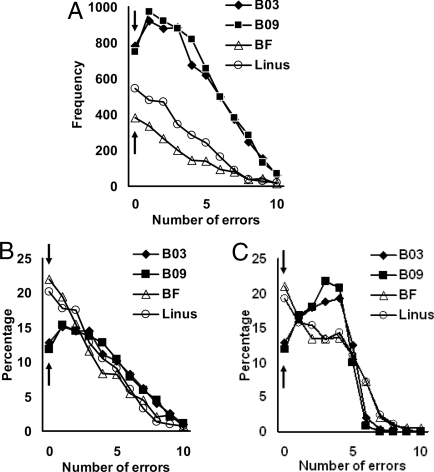
Fig. 1.
Distribution of errors over the first 10 acquisition trials. Shown is the frequency (A) of all picture-response acquisitions for the 2 pigeons (open symbols) and baboons (filled symbols) as a function of the number of choice errors made during the first 10 presentations (excluding the mandatory first trial guess) of each image with correction trials excluded. The percentage of acquisitions computed without (B) and with (C) correction trials included is shown. The arrows in A–C point to the errorless acquisitions indicative of 1-trial learning.

